
Building the culture of experimentation and enabling a smooth process for building, running, and analyzing experiments across all product lines. This platform, named EXP, was then to be extended to Merchants to conduct A/B Tests independently on their online store to measure the impact of their business decisions based on customer behavior on their store.
Product Design Lead
Ux Research
UI Design
User Test & Analysis
Prototyping
Workshop Fecilitation
3 Data Developers
1 Front End Developer
1 Product Manager
2 Data Scientists
1 Product Designer
Jan 2020- May 2020
Led to an increase in experiments
created by 1000% within first 6 months of launch.
Experimentation ( or online A/B Tests) helps make informed decisions on the product based on key metrics of interest. For a growing organisation such as Shopify, it becomes increasingly important to measure the impact of decisions made on various product offerings to the merchants. To support the fast shipping culture and make data backed decisions, the data infrastructure needed to be revamped to support the teams iterating with speed on their product lines to conduct A/B tests and learn from the user behavior.
This project aimed at building the culture of experimentation and enable a smooth process for building, running and analyzing the results for experiments across all product lines.
This platform was to be extended to the merchants to conduct A/B tests on their online store to measure the impact of their business decisions based on buyer behavior.
Total experiments conducted since 2014
Experiments conducted in the past one year
Product lines conducting regular experiments
Incrementally improve the existing experimentation system that allows Data Scientists, Developers, Product Managers to easily build an experiment end to end; from defining hypothesis to serving treatments and analyzing results with no complexity. And as a result,
The number of experiments conducted annually
# Experiments Completed
# Product Users
Experiments Build Time
Error Rate
This was the first time that the Developers and Data Scientists in the team were working with a designer and I was working within the Data Org for the first time as a designer. As the only designer in the team, my role was:
Leading the project through Design by involving the team in the process and educate about my role
Align with the team on the user problems by conducting user research and prioritize engineering and business concerns for the MVP release
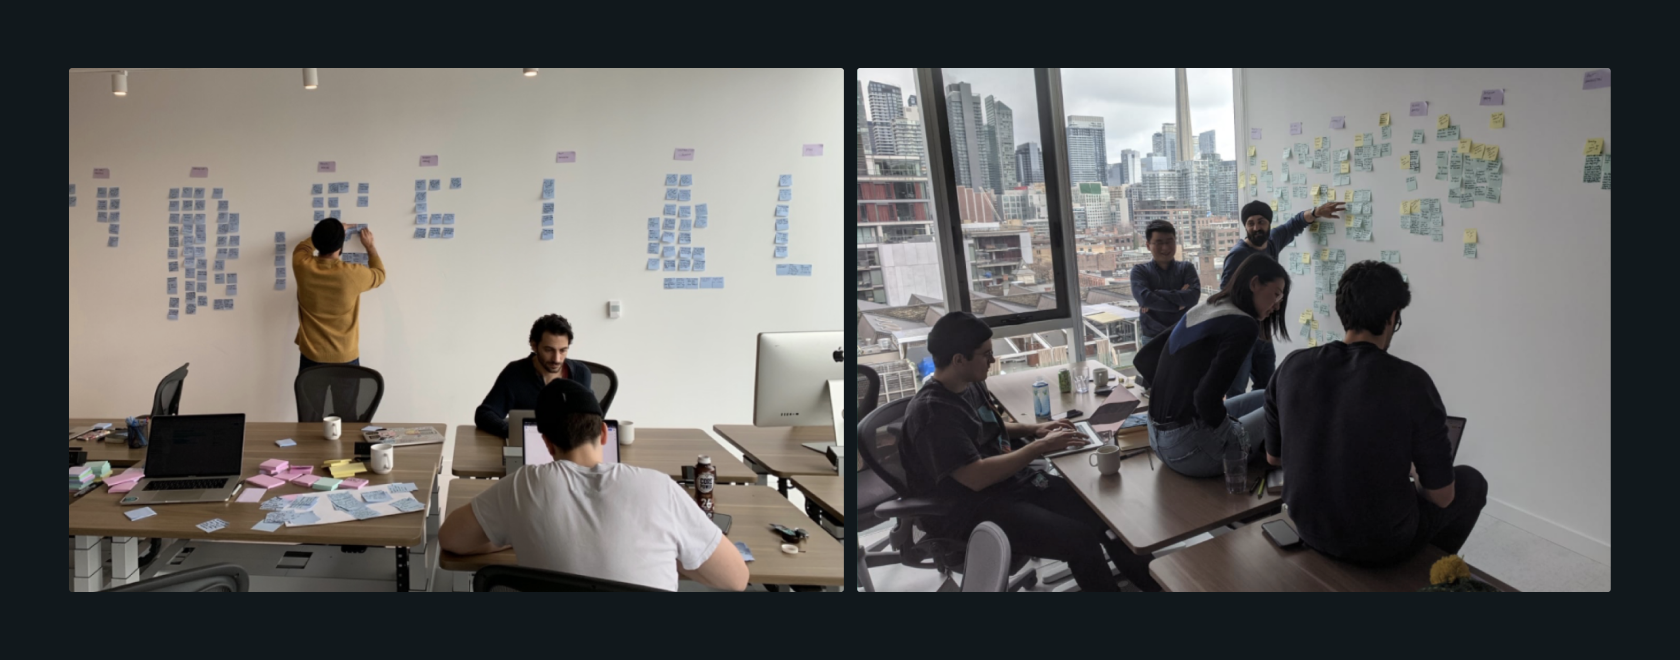
Conducting design workshops involving developers for better understanding of the functioning of the system
Design and build interactive prototypes to test with the users for feedback
Support developers on documentation and development of the tool
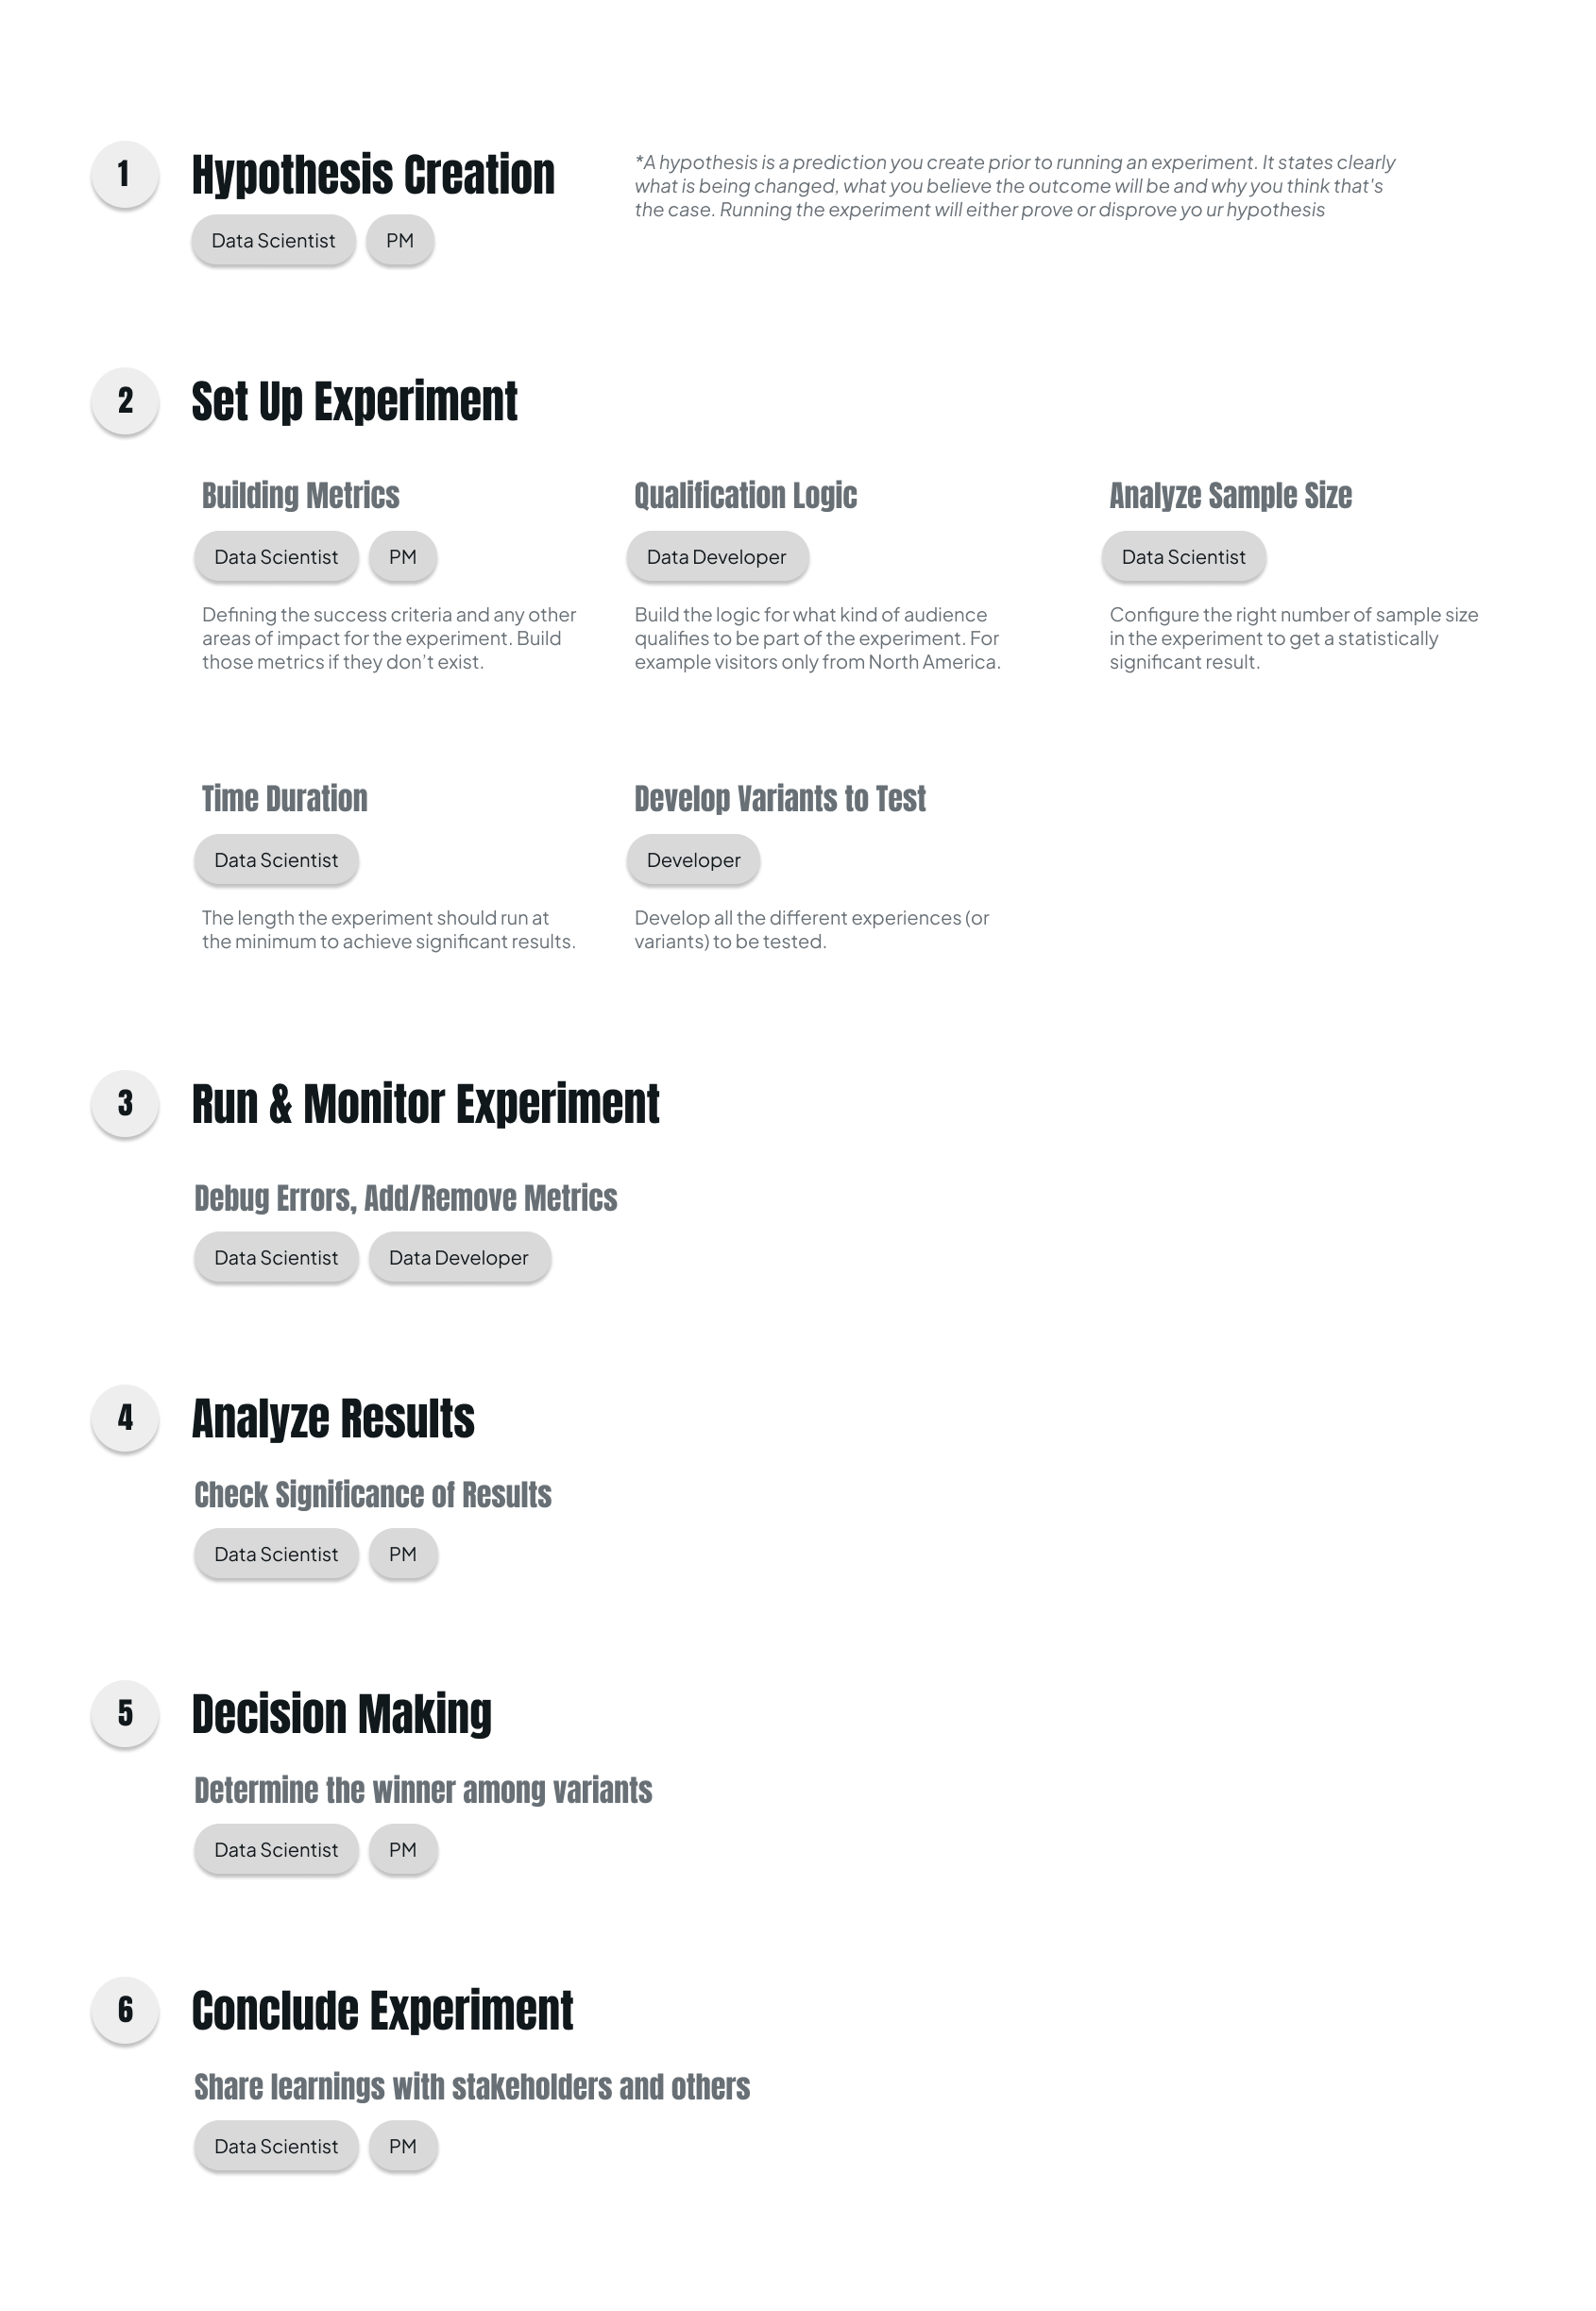
Understand the different experiment workflows Data Scienists, Developers and Product Managers use for A/B Testing.
Understand the main blockers and challenges with the current system from defining hypothesis to setting up experiment and analyzing results to make decisions.
Understand the different use cases of experiments from various product teams and user personas
( e.g. testing front-end, back-end or algorithm changes, one-off random A/B test or continuous testing).
Gain a better understanding of the culture and education problem.
Build the metrics and configure the experiment the right way ensuring ‘who’ the right subjects for the experiment are and how much time it might take to obtain statistically significant results.
Responsible for the decision making on the results obtained.
Ensure the proper functioning of the assignment mechanism.
That is, ensure the right candidates (example - visitors on Shopify.com from Canada) are included in the experiment and sustained for the right duration.
Lack of understanding of experimentation concepts, values, practice, statistics and technical limitations with the system led to a popular opinion that experimentation is HARD.
People think that running experiments is costly and delays product development and not worth making the investment.
People see value in building experiments to optimize existing features, however many people do not see much value when shipping brand new features or products.
The perception that experimentation does not generate positive ROI, unclarity on when to experiment, primarily lead to the lack of experimentation culture.
Many reviews are required on the development side before an experiment can actually be launched.
There is no one place in the system to see a full picture of the experiment. Data Scientists and Data Developers define experiments with two sets of metadata in two different systems.
People see value in building experiments to optimize existing features, however many people do not see much value when shipping brand new features or products.
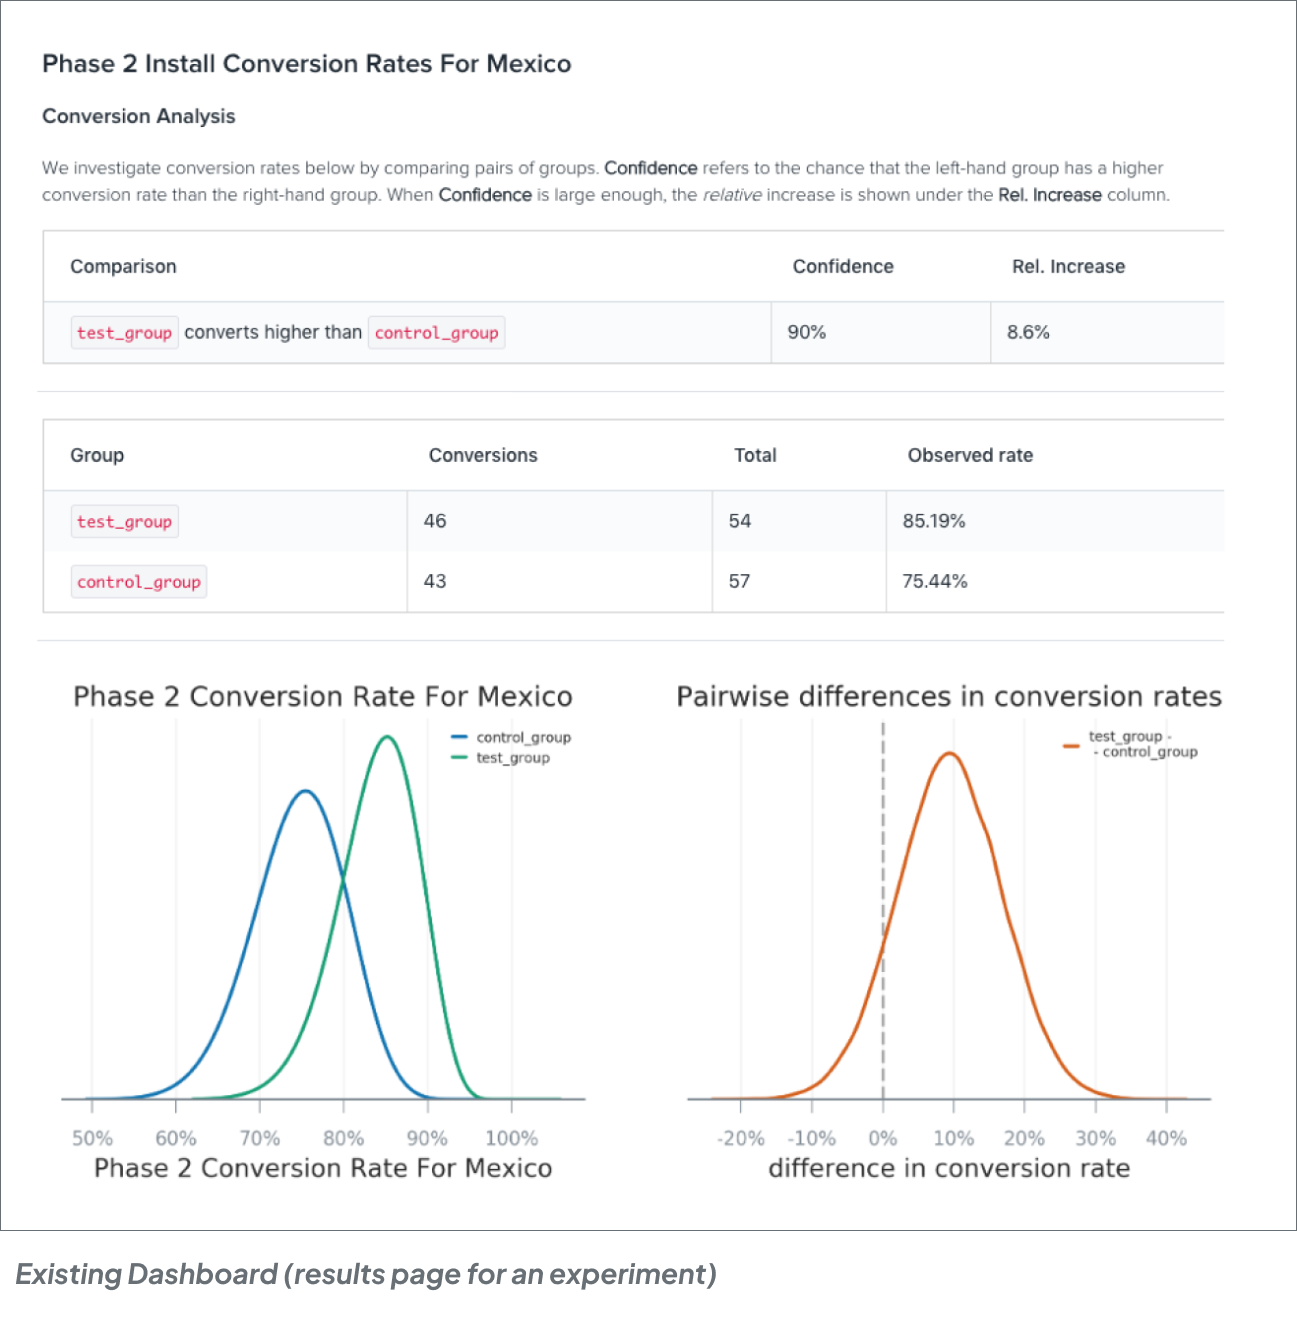
The dashboard was catered towards data scientists who have the technical understanding of the statistical term used and not for other experiment observers. Terms like ‘Confidence level’, ‘inconclusiveness’ of an experiment were misunderstood.
“Ongoing experiments give a false interpretation which stakeholders don't necessarily understand”
“I don't know what 90% confidence really means!”
Discovering current and past experiments and understanding the impact of similar previous experiments was complex. It was hard to know ‘overlapping’ or ‘conflicting’ experiments and their effects.
“Its hard to find previous examples of people tackling the same problem”
Lack of a standardised way to create, track, debug, conclude or ‘kill’ (Immediately end) an experiment led to customized workarounds for teams and used more time to implement.
“We ran a lot of experiments in parallel and it was hard to track them”
Decision maker
Defining hypothesis
Configure experiment, analyze and share results with the decision maker
Ensure qualification logic and group assignments are implemented correctly
Make quick and informed decisions to ship as fast as possible
May prefer speed over accuracy at times
Use the right metrics and analysis to derive accurate results with ease
Set up experiments in the application seamlessly with minimal complexity
Clear understanding of ROI
(Value of experiment need to be higher than cost to experiment
Accuracy and simplicity of results
Communication to stakeholders
Risks involved, possible delays and implications of not experimenting
Experiment design: Hypothesis, metrics, audience and end impact
Accuracy of results
Simplicity of workflow to minimize efforts
Time and effort involved to set up experiment back-end in apps
Seamless integration with their current development workflow ( e.g. Code clean-up)
Based on the research insights and the engineering time and effort involved in building the data infrastructure to support the new experiments system, we narrowed our objectives to the following:
Since this was a very technical product, I consistently iterated and collaborated with the technical experts ( both engineering and statistics) to obtain further clarity on the domain and functionality of the product. It involved understanding how the data infrastructure works, checks on technical feasibility, business requirements and UI consistencies.
I worked closely with Data Scientists, Data Developers, Product Manager, domain experts ( Statistics - PhDs) to iterate and review with other UX folks and Content Designers for feedback.
This required multiple concepts and iterations.
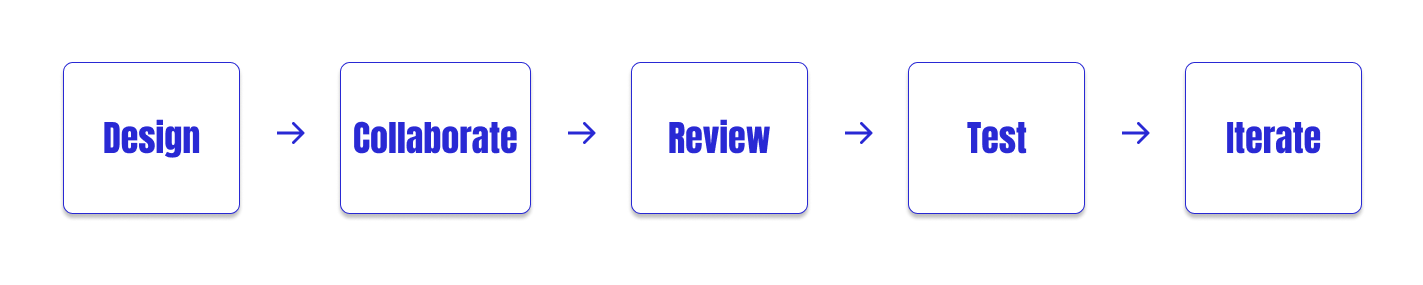
Based on the prior research and the above objectives, we prioritized improving the following experiences:
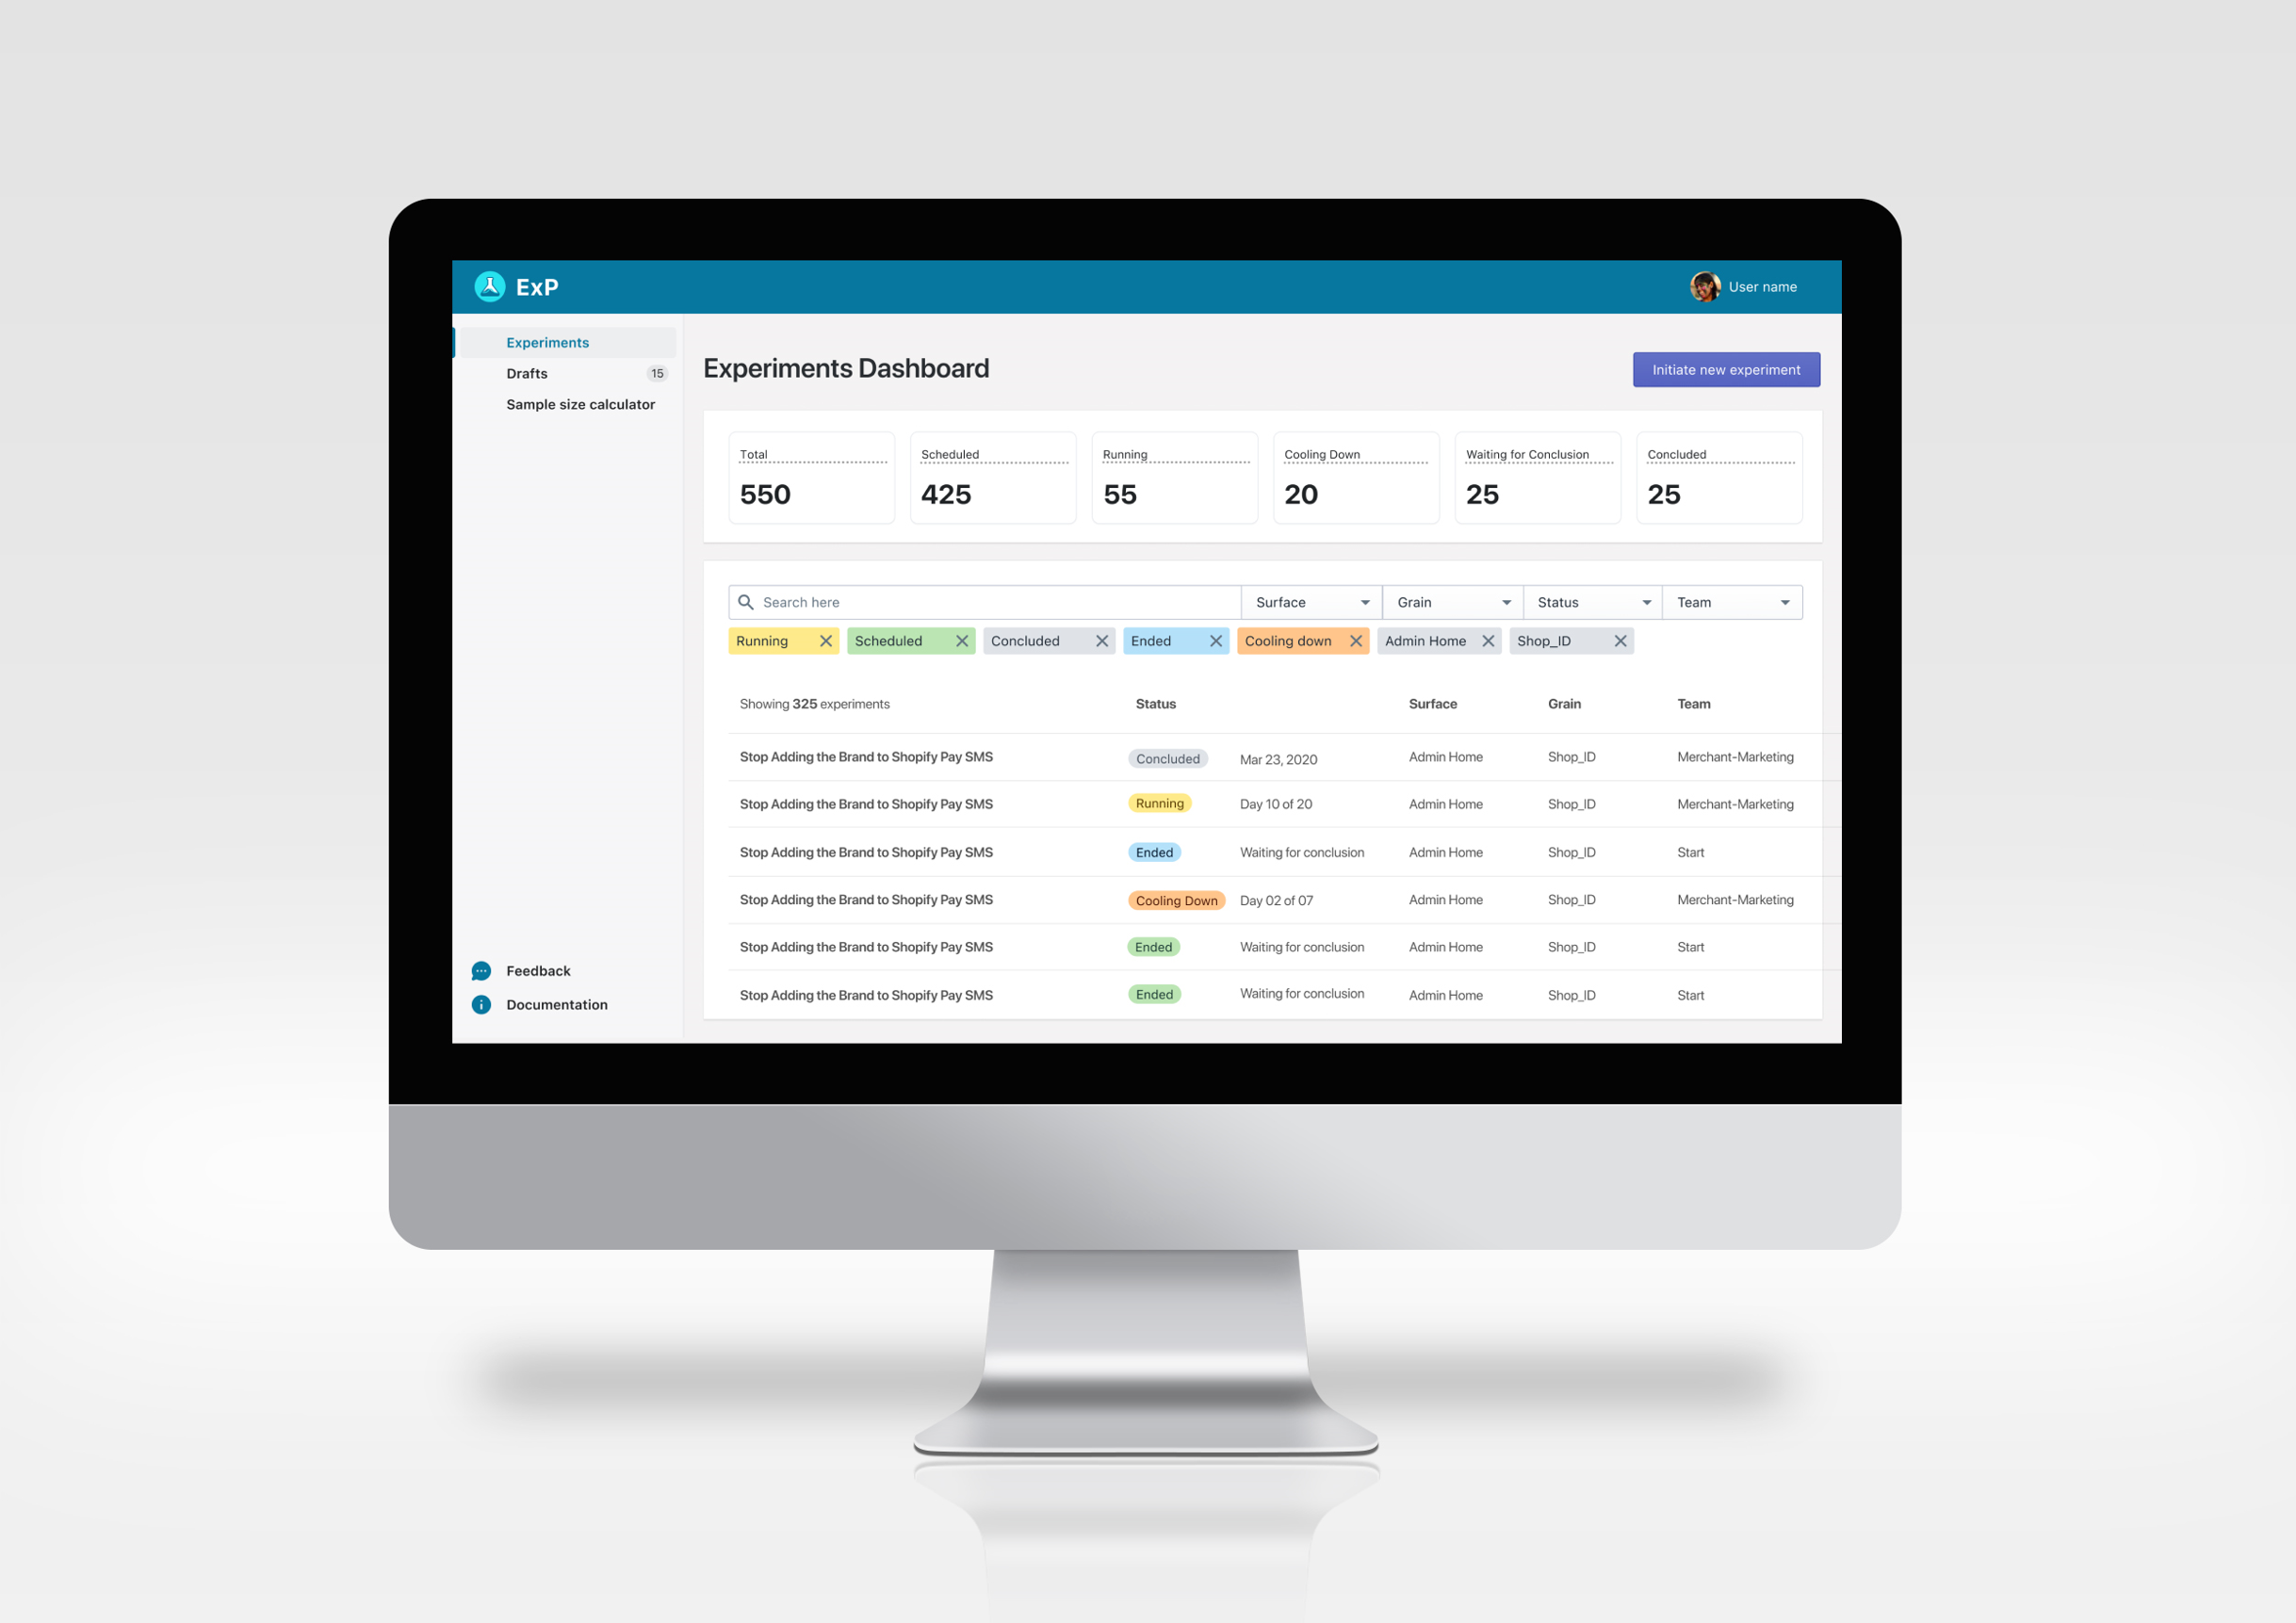
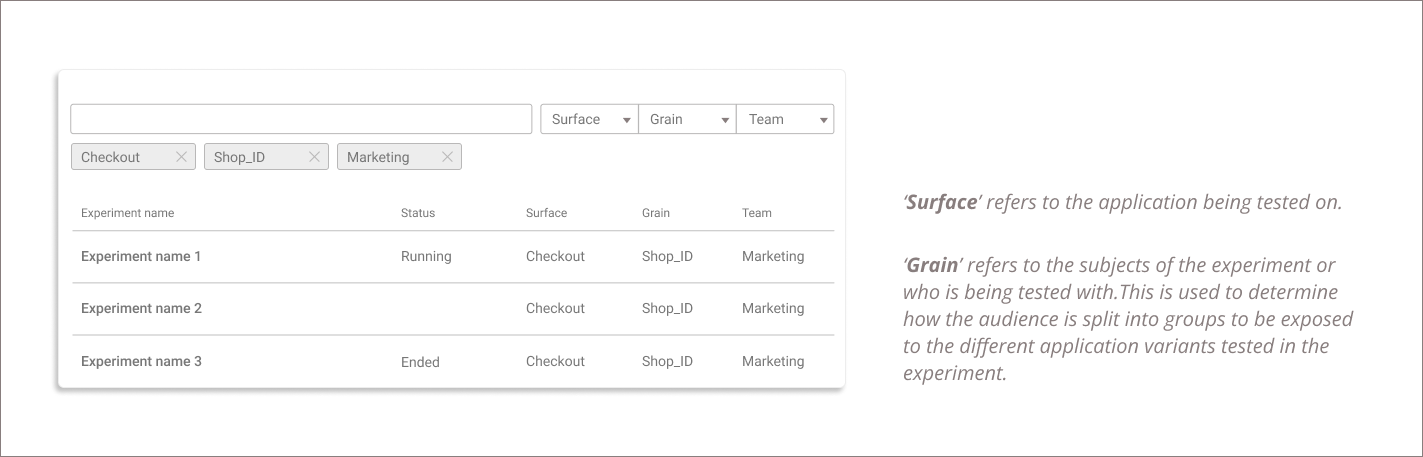
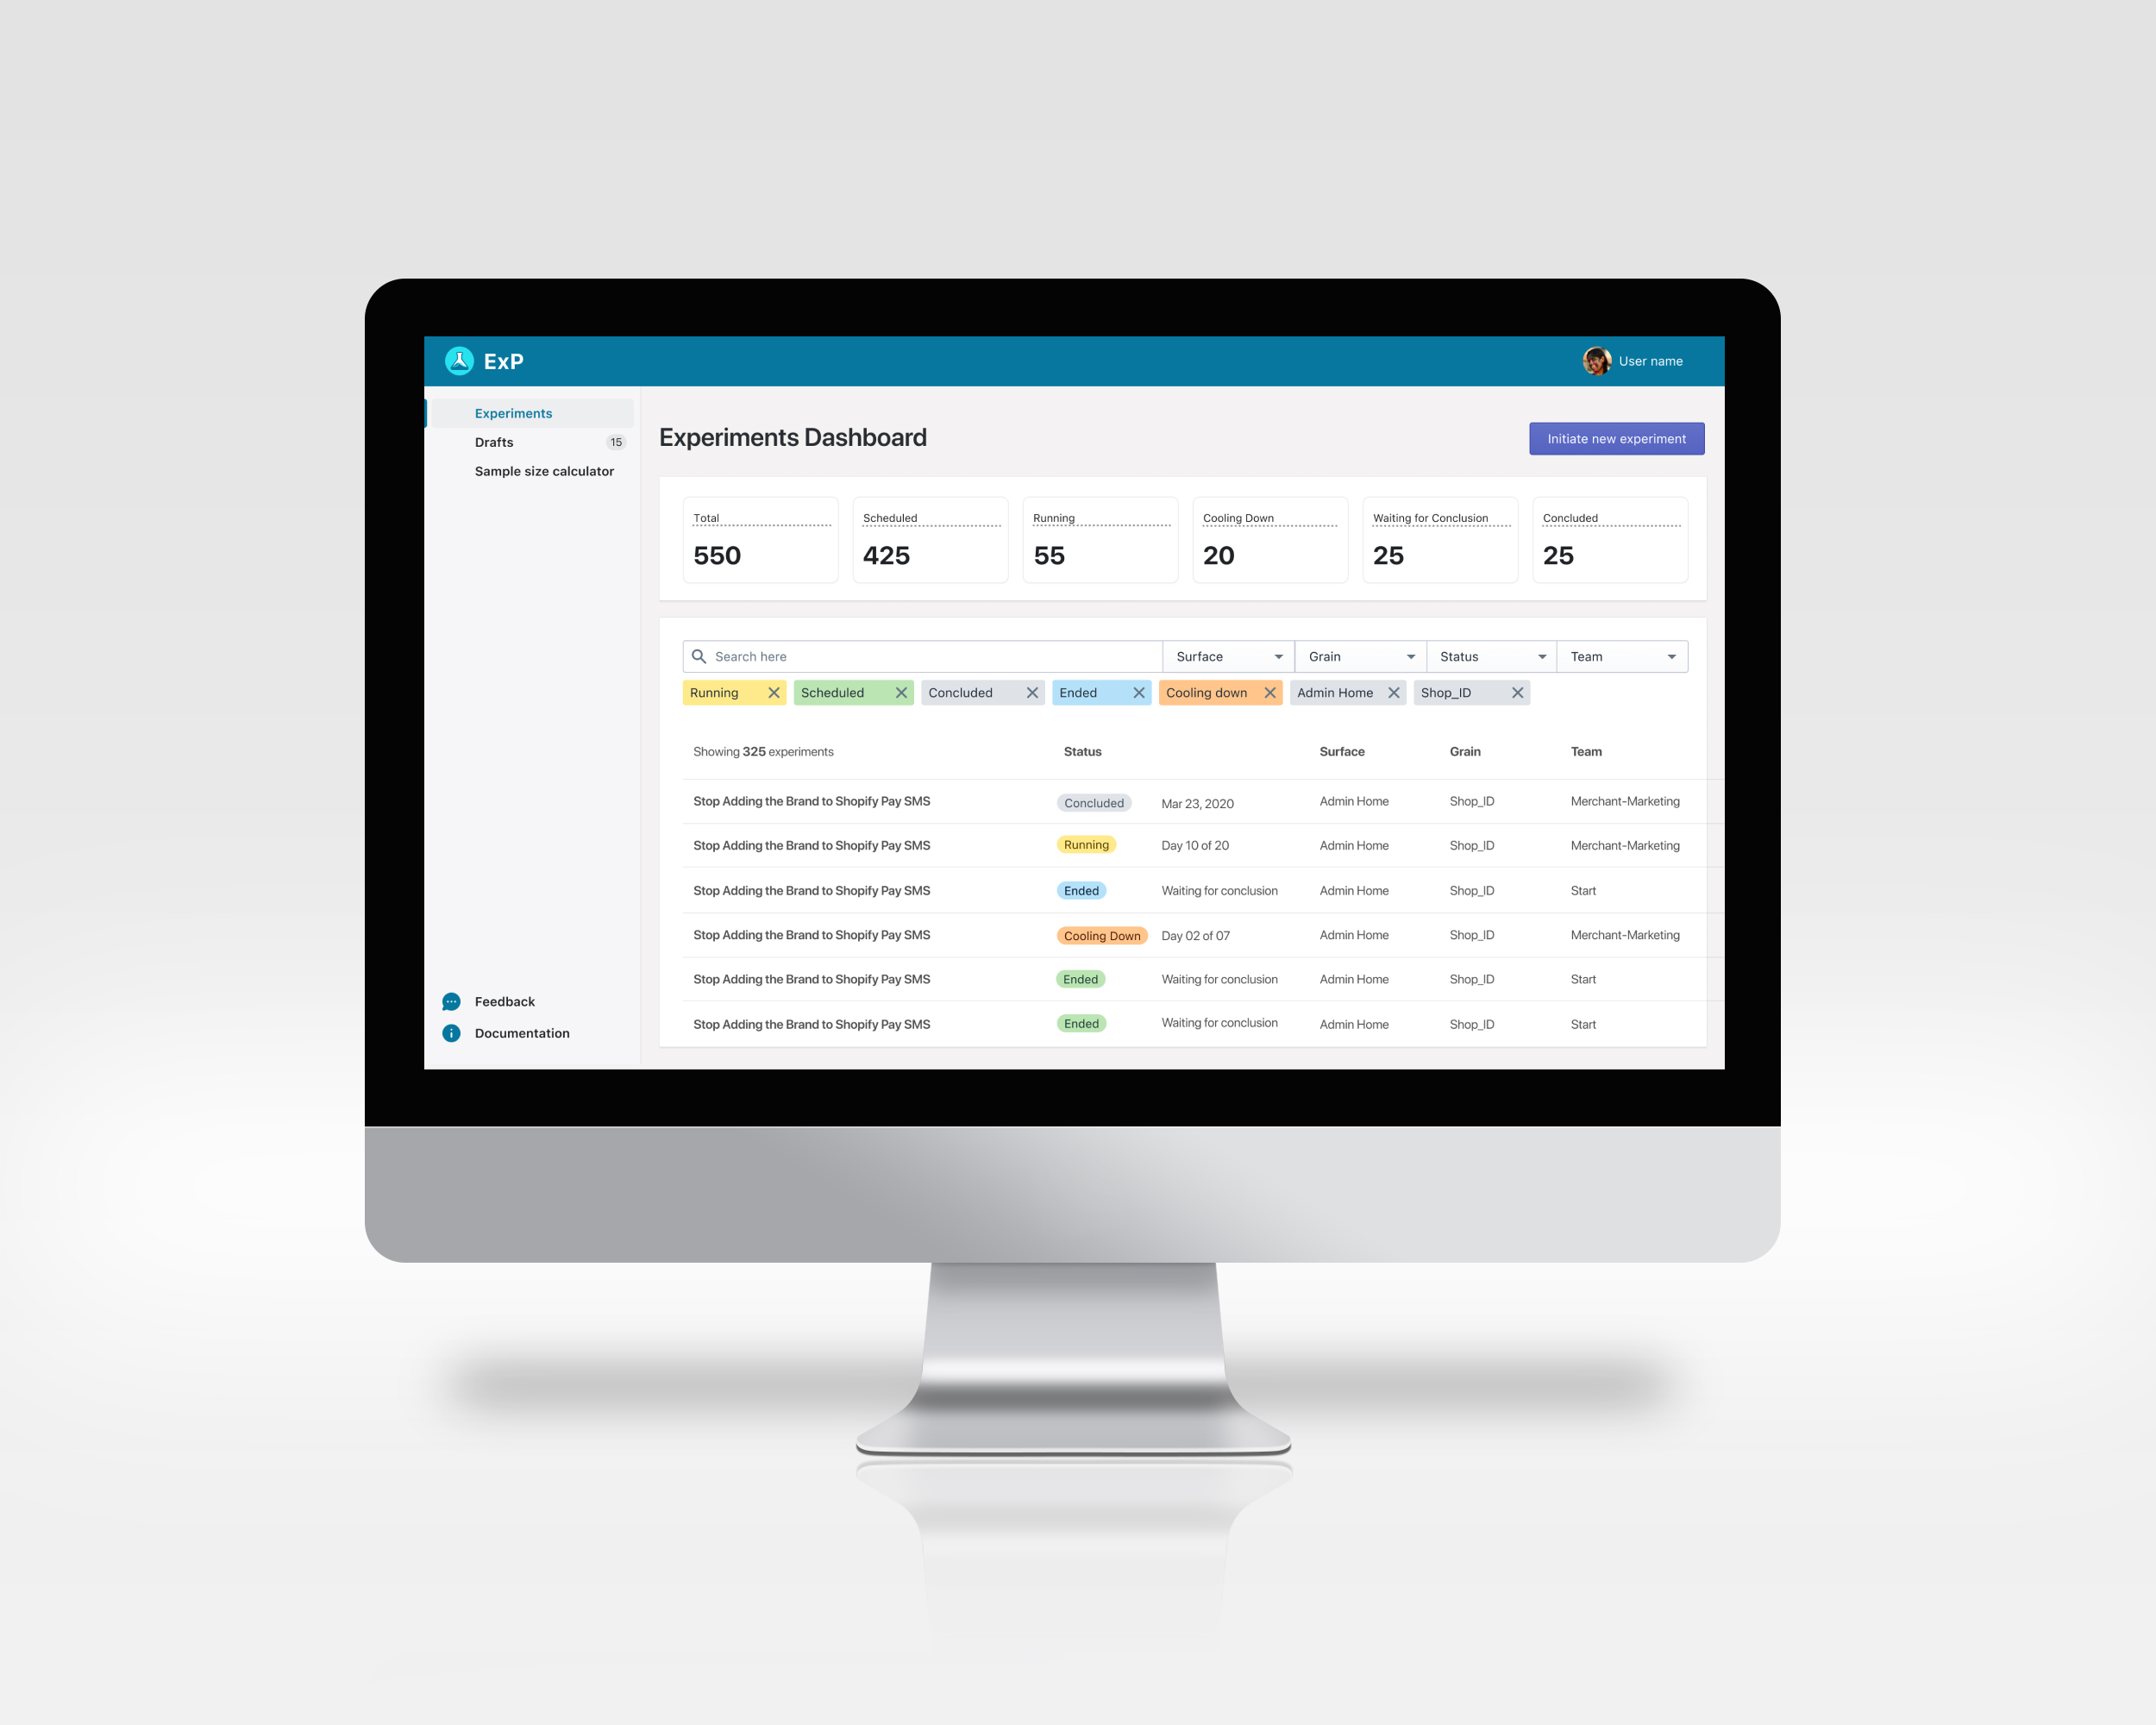
Quickly find experiments of interest.
Clarity on owners, applications, subjects and experiment status .
Minimize complexity in building experiments.
Automate complex tasks like group assignments i.e. Manage and track which visitor will be exposed to which variant (A or B, also referred as ‘Test’ and ‘Control’ groups)
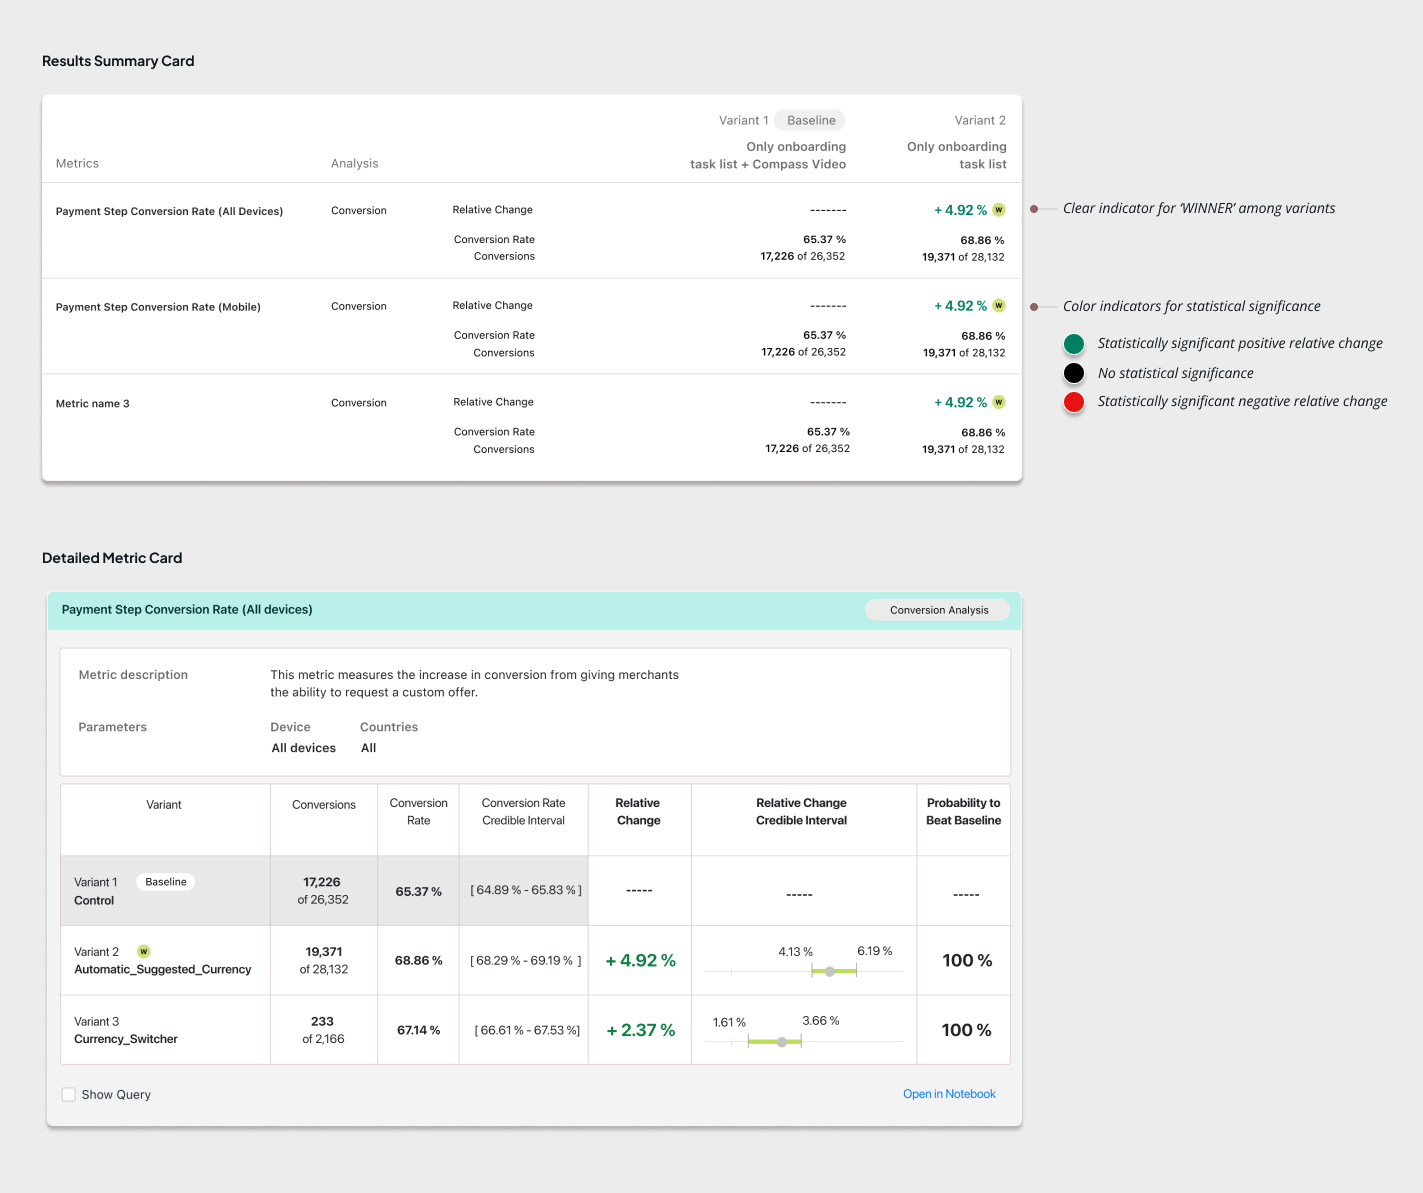
Make interpretation of results simpler ( even for non-data folks)
Clear indicators for result directions, with significance
Users needed a simpler way to find the experiments that might be of interest to them. This could mean the experiments by a particular team, or a test running on a particular application ( also called ‘surface’). For this, a simple search function with the right filters made for a simpler interaction.
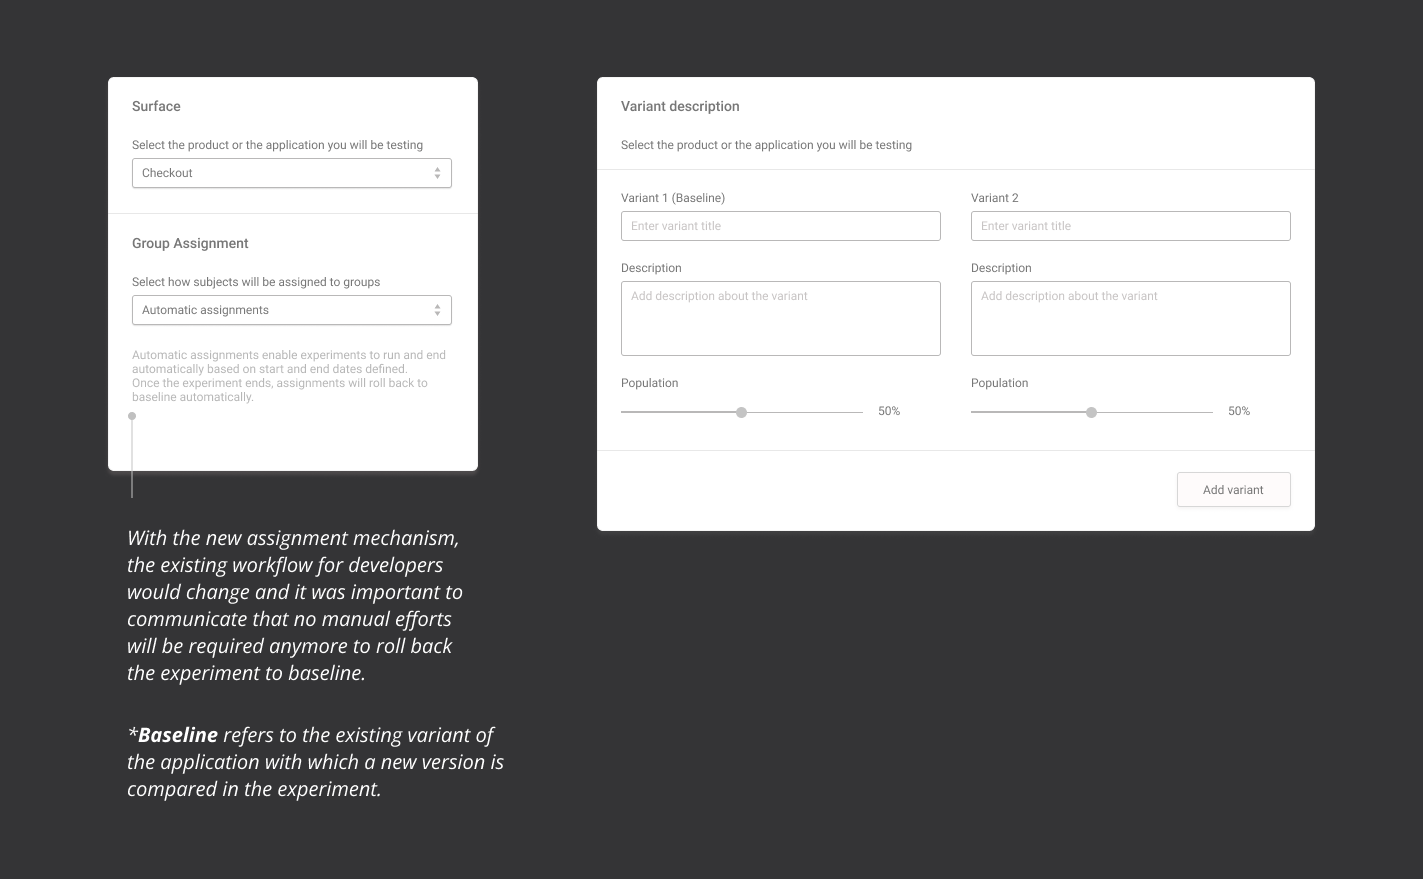
Building an experiment requires a lot of work on part of the data scientist and data developers. For example, discussions on the subject of the experiment (who is being tested with) and determining the percentage split (sometimes 70-30 or 50-50 ) depending on the type of experiment, and then associating the same with the right experiment is crucial.
The team developed a group assignment mechanism that automatically managed the splitting of the audience without the developer having to code the details. This could now be done simply through the UI of the experiments platform.
The results page was the most crucial because of the difference in expectation and requirement from the different users observing the experiment.
Needs all the details of the data captured for the metric and then analyse to check if there is statistical significance in the outcome.
Typically take a quick glance to learn how the experiment is performing.
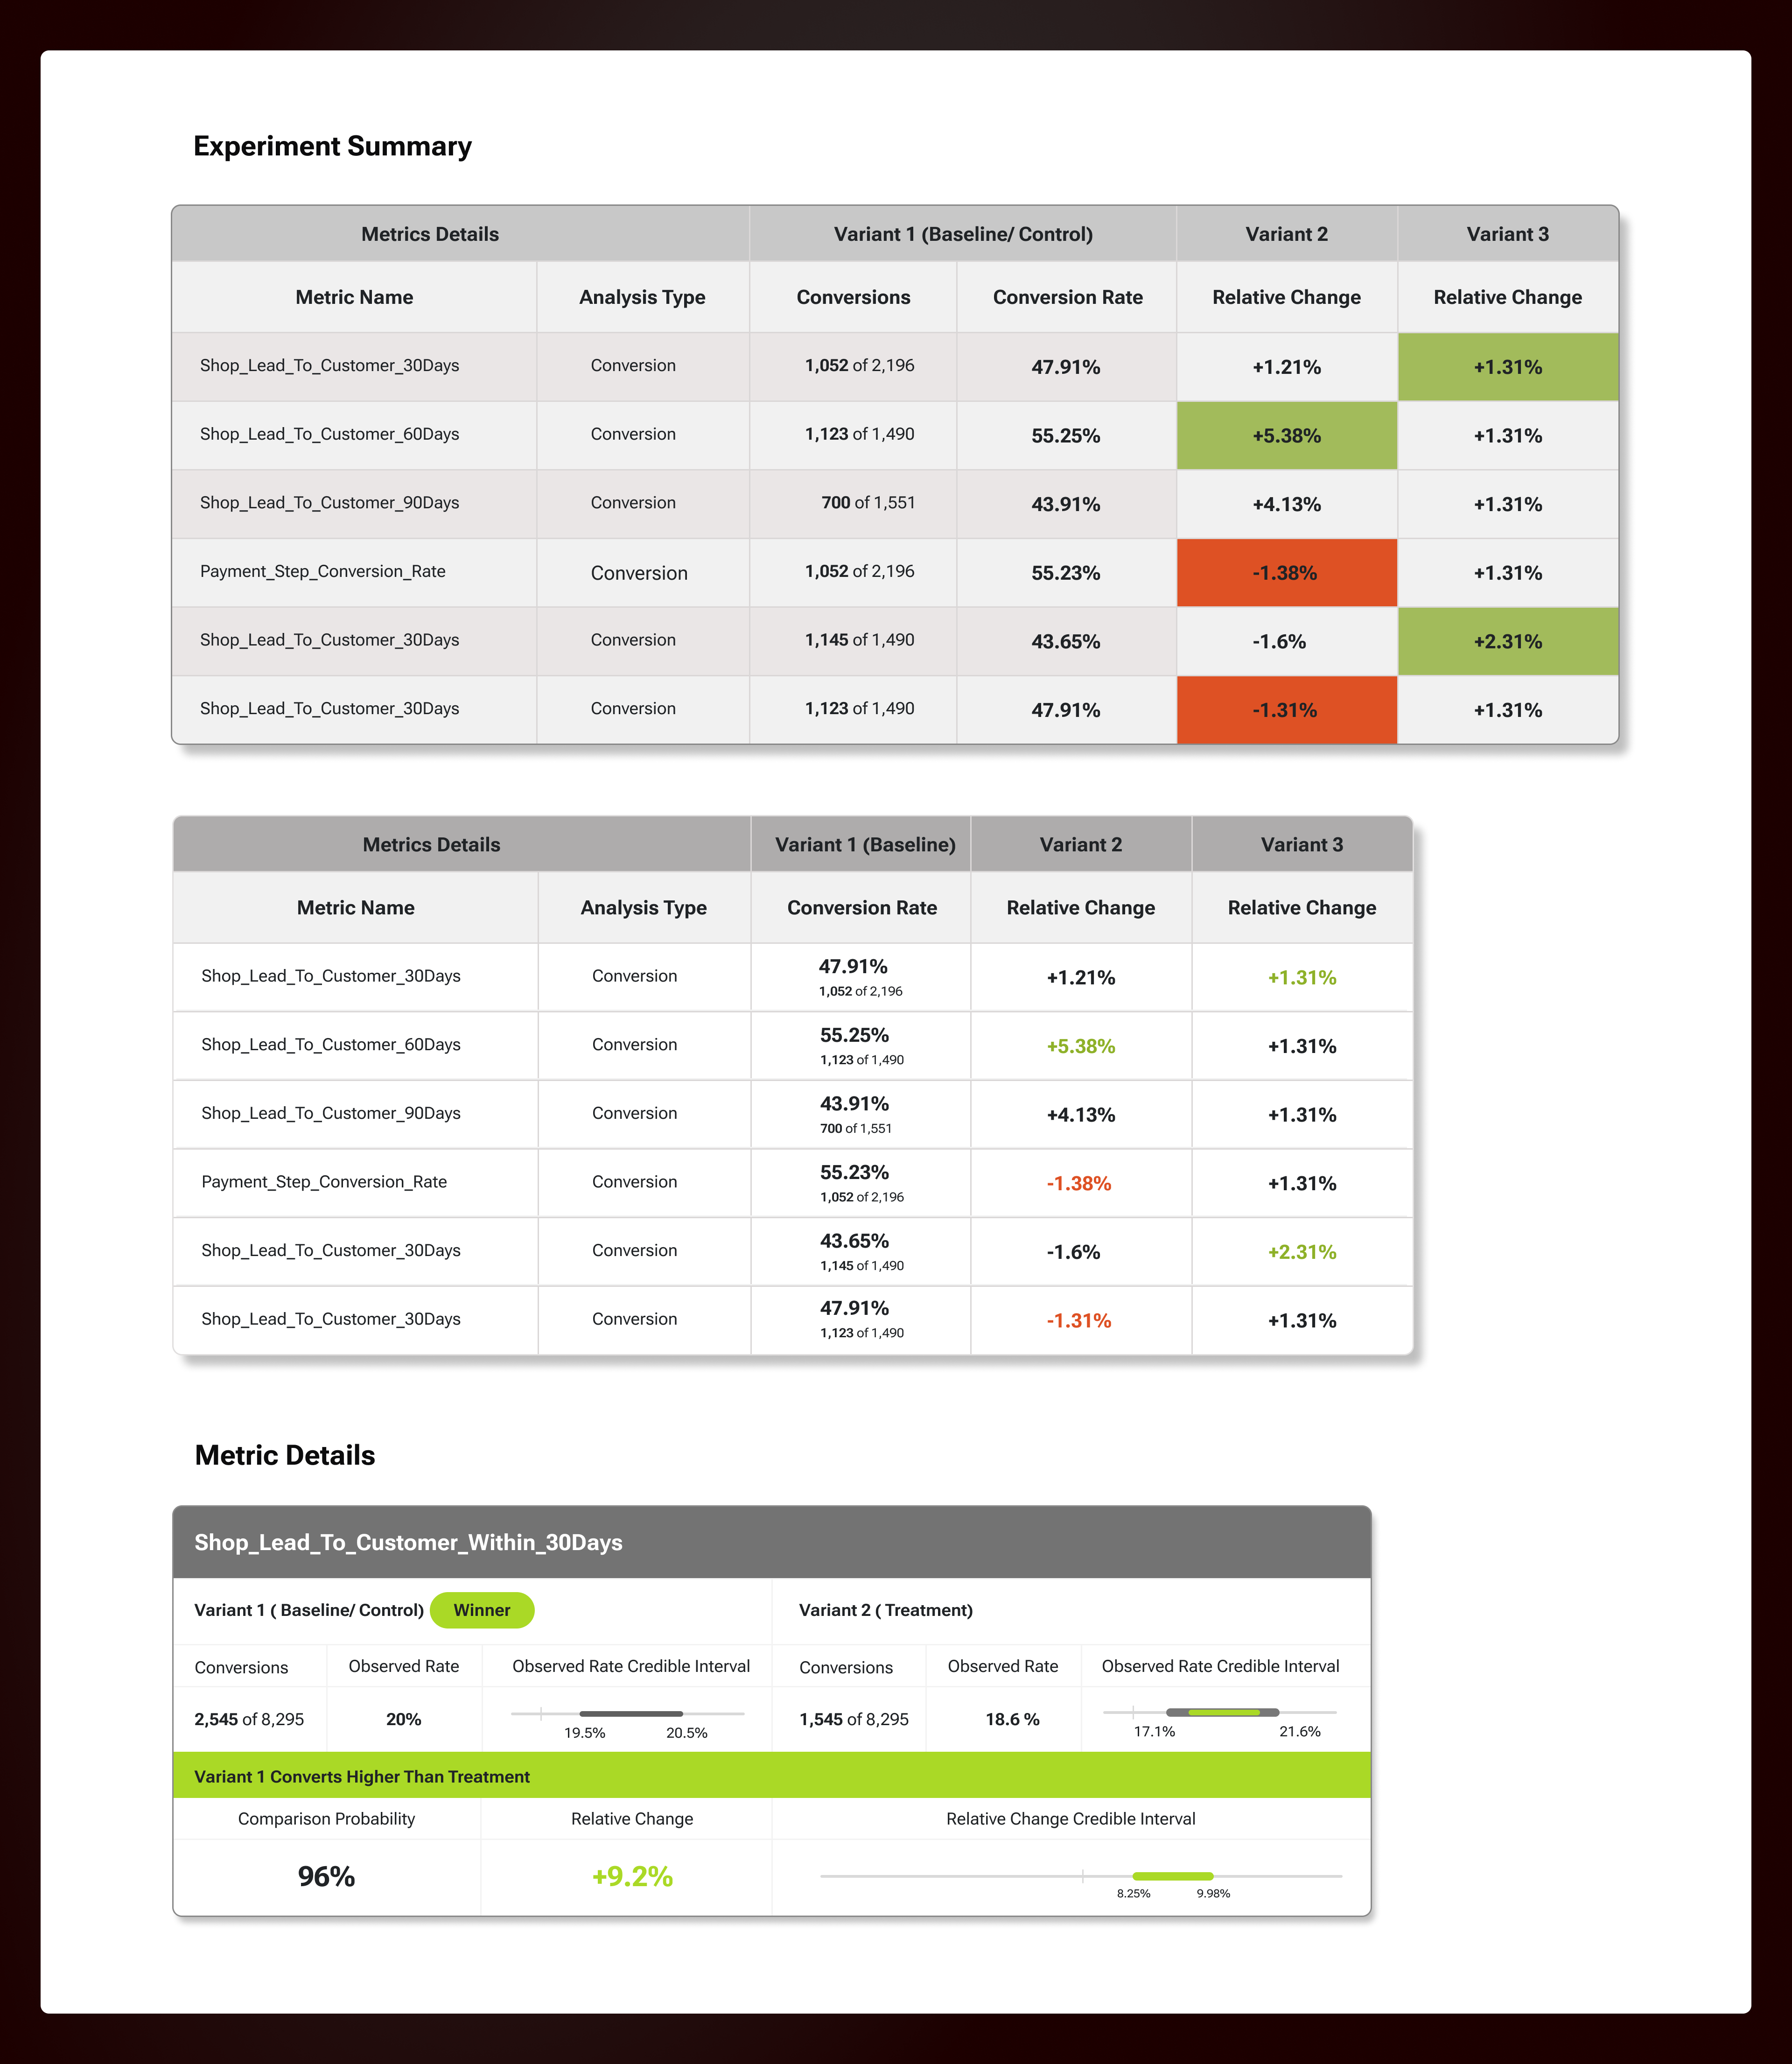
Based on the above and prior research, we made some design decisions for the results page:
This should give an indication about the winning variant & a clear indication of
the margin in difference or Relative Change.
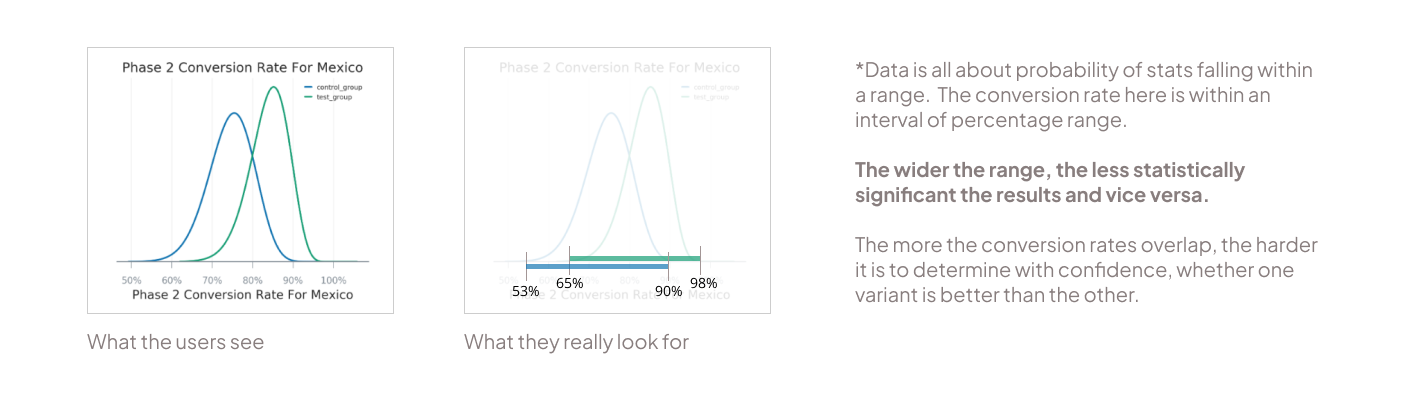
Bell curves are typical data visualizations used during statistical analysis by data scientists to compare data. However, for users with no background in data, this was overwhelming and they feel they need help to interpret.
What the data scientists really need is a comparison of any overlap in the credible intervals/ conversion rate (width of the bell curve) for the two variants.
We found that terms like ‘confidence level’ are not universally understood. Typically confidence level determines how likely the stats being shown on the table are true. This leads to more confusion as what confidence level is good for decision making is not clear. Mostly understood as 95%, but there may be cases where 70% is also good enough.
To bring more simplicity, we replaced confidence level with ‘Probability to beat baseline’. A percentage that shows the likelihood that the test variant gets better conversion rate than the baseline variant (or control group). This helps users decide with a clearer information.
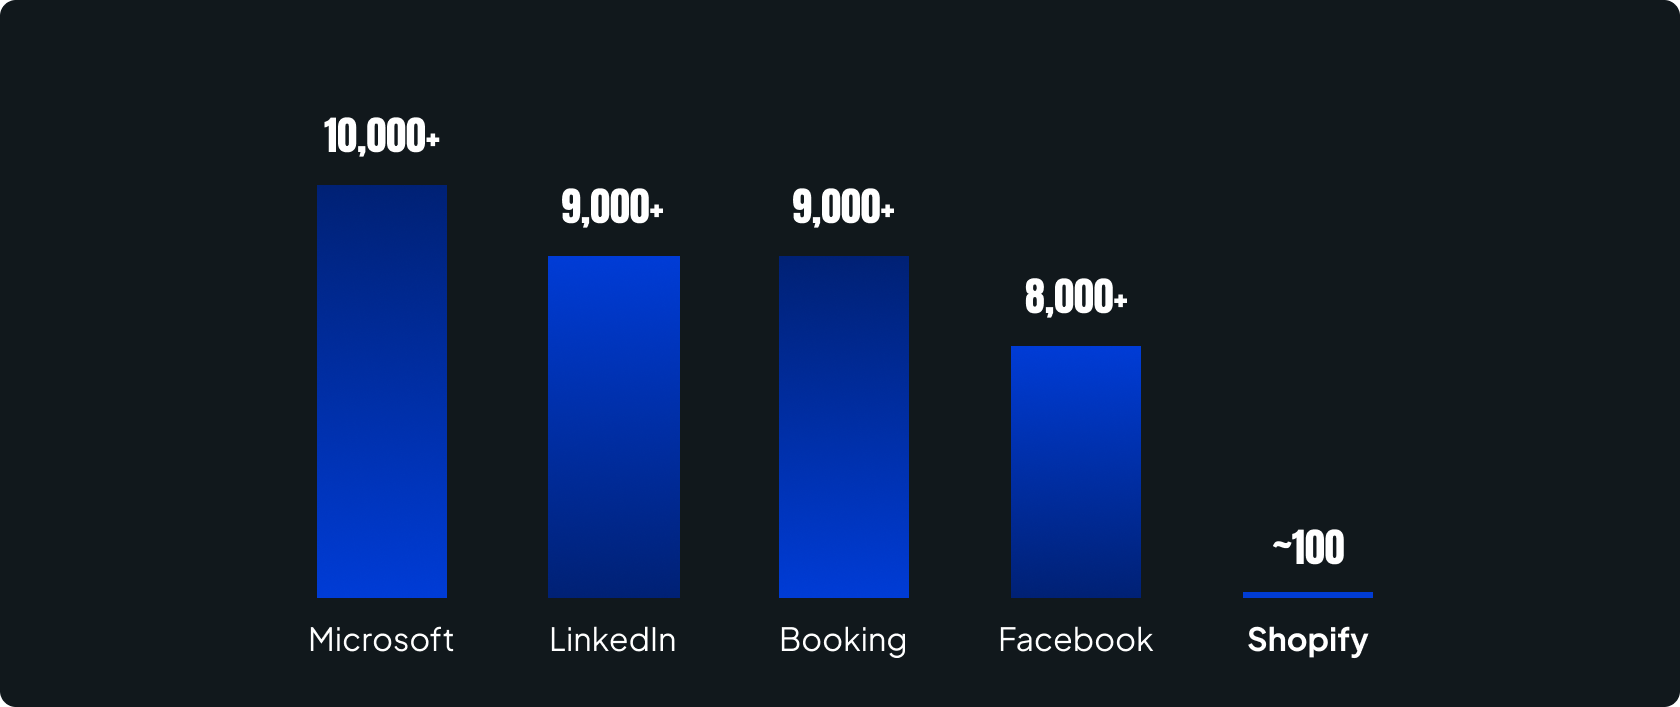
With the successful release of the new experiments platform in May 2020, the number of experments conducted had grown tremendously by December 2020.
We wanted to learn how these experiments contributed to the primary metrics for Shopify like Gross Merchandise Volume, or the Net New Merchants added onto the platform etc. But due to the complexity in the metrics infrastructure involved, it was hard to confidently suggest the link. But overall, the platform has been well appreciated and seen a greater adoption across all teams and application verticals in the organisation.To introduce new members to the culture of experimentation, the tool became a part of the onboarding program for all new joinees including UX designers.
The success of the platform led to the planning of expansion of the same to Shopify merchants to set up experiments on their online store to measure the impact of the business decisions they make based on buyer behavior. This project was put on hold due to budget and infrastructure constraints.
Working on a complex technical tool was quite a learning experience for me. With no prior knowledge base in Data and as the only designer in the team, it was initially overwhelming but regular discussions with my team helped me learn about the domain.
I wrote a blog post that was published by Shopify UX where I shared my learnings. I have summarized the same here:
Serious technical terms specially in the domain of work like Statistics and Probability can be overwhelming. Know only how much you need to know to be effective in your role and make efforts to learn enough to unblock your own flow.
Reach out and build your circle. Seek help when needed and collaborate with members in other teams. You are not alone, others might also feel the same.
Being new in the domain (Data for me), one can feel out of place. But know that there are no stupid questions indeed! No one judges you and everybody is happy to help.
Familiarize the team with your work and seek early feedback. A complex tool requires help from experts to guide the design decisions at an early stage. This helps set the expectations leading to smoother process.

